

WELCOME
MITTELSTAND INTERNATIONAL
an international association for medium-sized and family-run enterprises.


MITTELSTAND INTERNATIONAL
MITTELSTAND INTERNATIONAL is an international association that specializes in the needs of medium-sized and family-run enterprises.
We organize events on different scales for our members to support them mastering the challenges they face on a daily basis.
We see ourselves as a platform for decision makers and entrepreneurs across different branches to learn from each other.
Events for your success
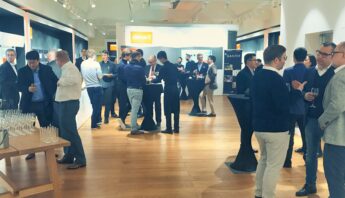
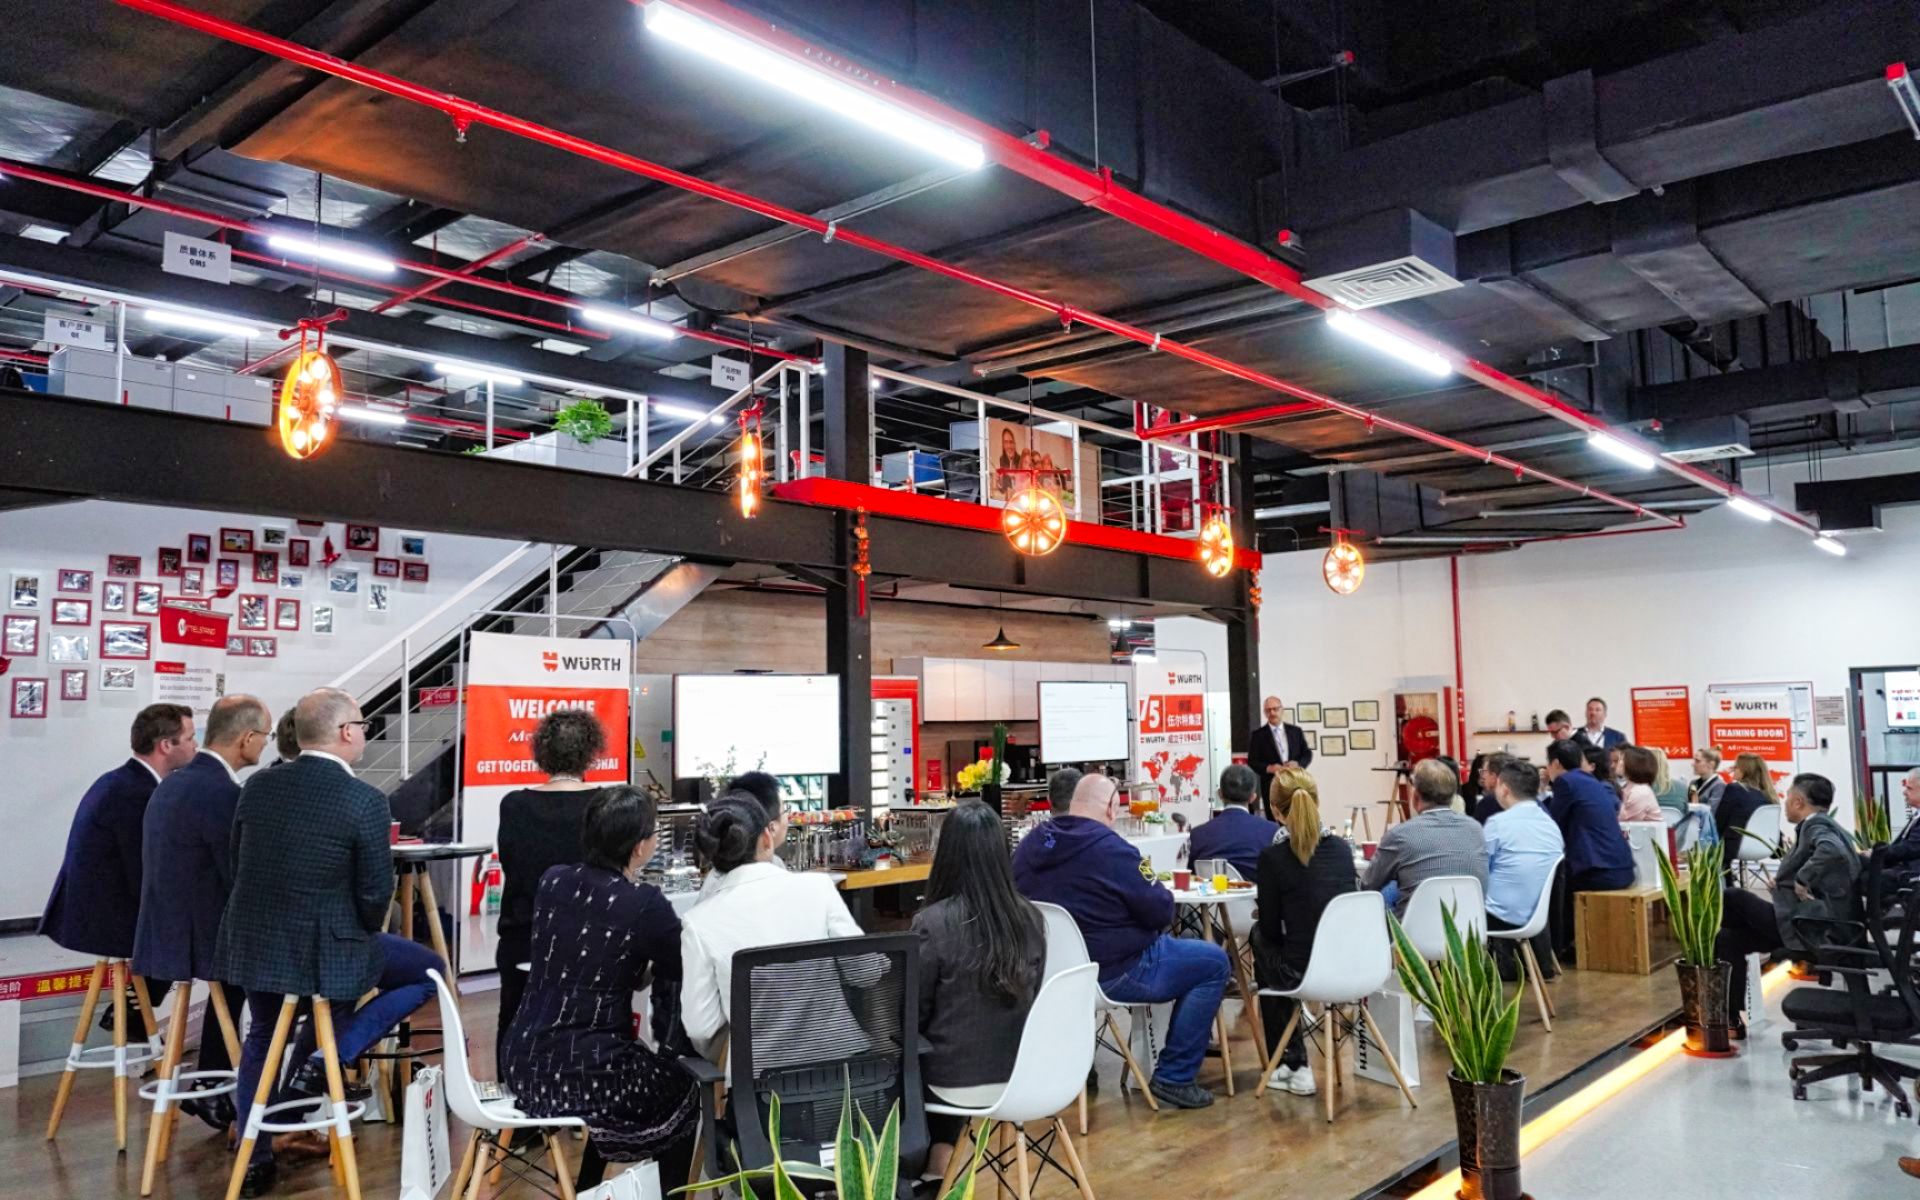
Get Together
Organized on a monthly, bi-monthly or quarterly term.
At these events, a member of MITTELSTAND INTERNATIONAL offers a presentation on a certain topic, which is then discussed with the audience.
The venues are chosen by the speakers and can vary between a restaurant / hotel or the member`s company.
The events are limited to max. 30 participants.
The target audience: company owners, senior management (CxO).
Dress code: business casual

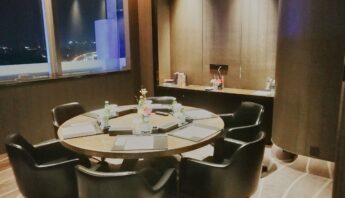
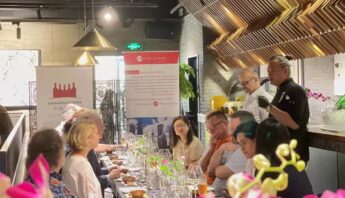
Executives
- Executive Roundtable
- Executive Seminar
- Executive Workshop
Organized on a monthly, bi-monthly term.
At these events, a member of MITTELSTAND INTERNATIONAL offers a presentation on a certain relevant topic, which is then discussed with the audience in an intimate athmosphere with culinary delights.
The venue is a sophisticated and elegant 5-star hotel.
The audience is limited to 8 guests.
The workshop format has a limitation of 4 guests.
The maximum benefit for our participants is the focus at MITTELSTAND INTERNATIONAL.
The target audience: company owners, senior management (CxO) and academics.
Dress code: business formal
- Previous topics:
- Corporate Social Credit System (CSCS)
- Whistleblower Management
- Anti-Money-Laundering (AML)
- LIeferkettengesetz
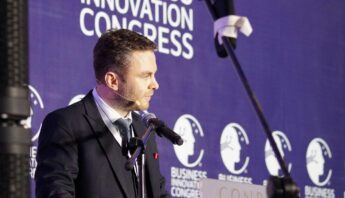
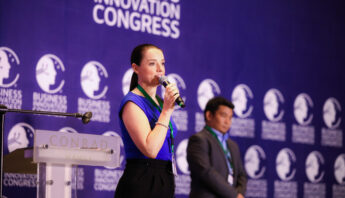
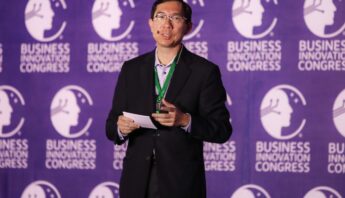
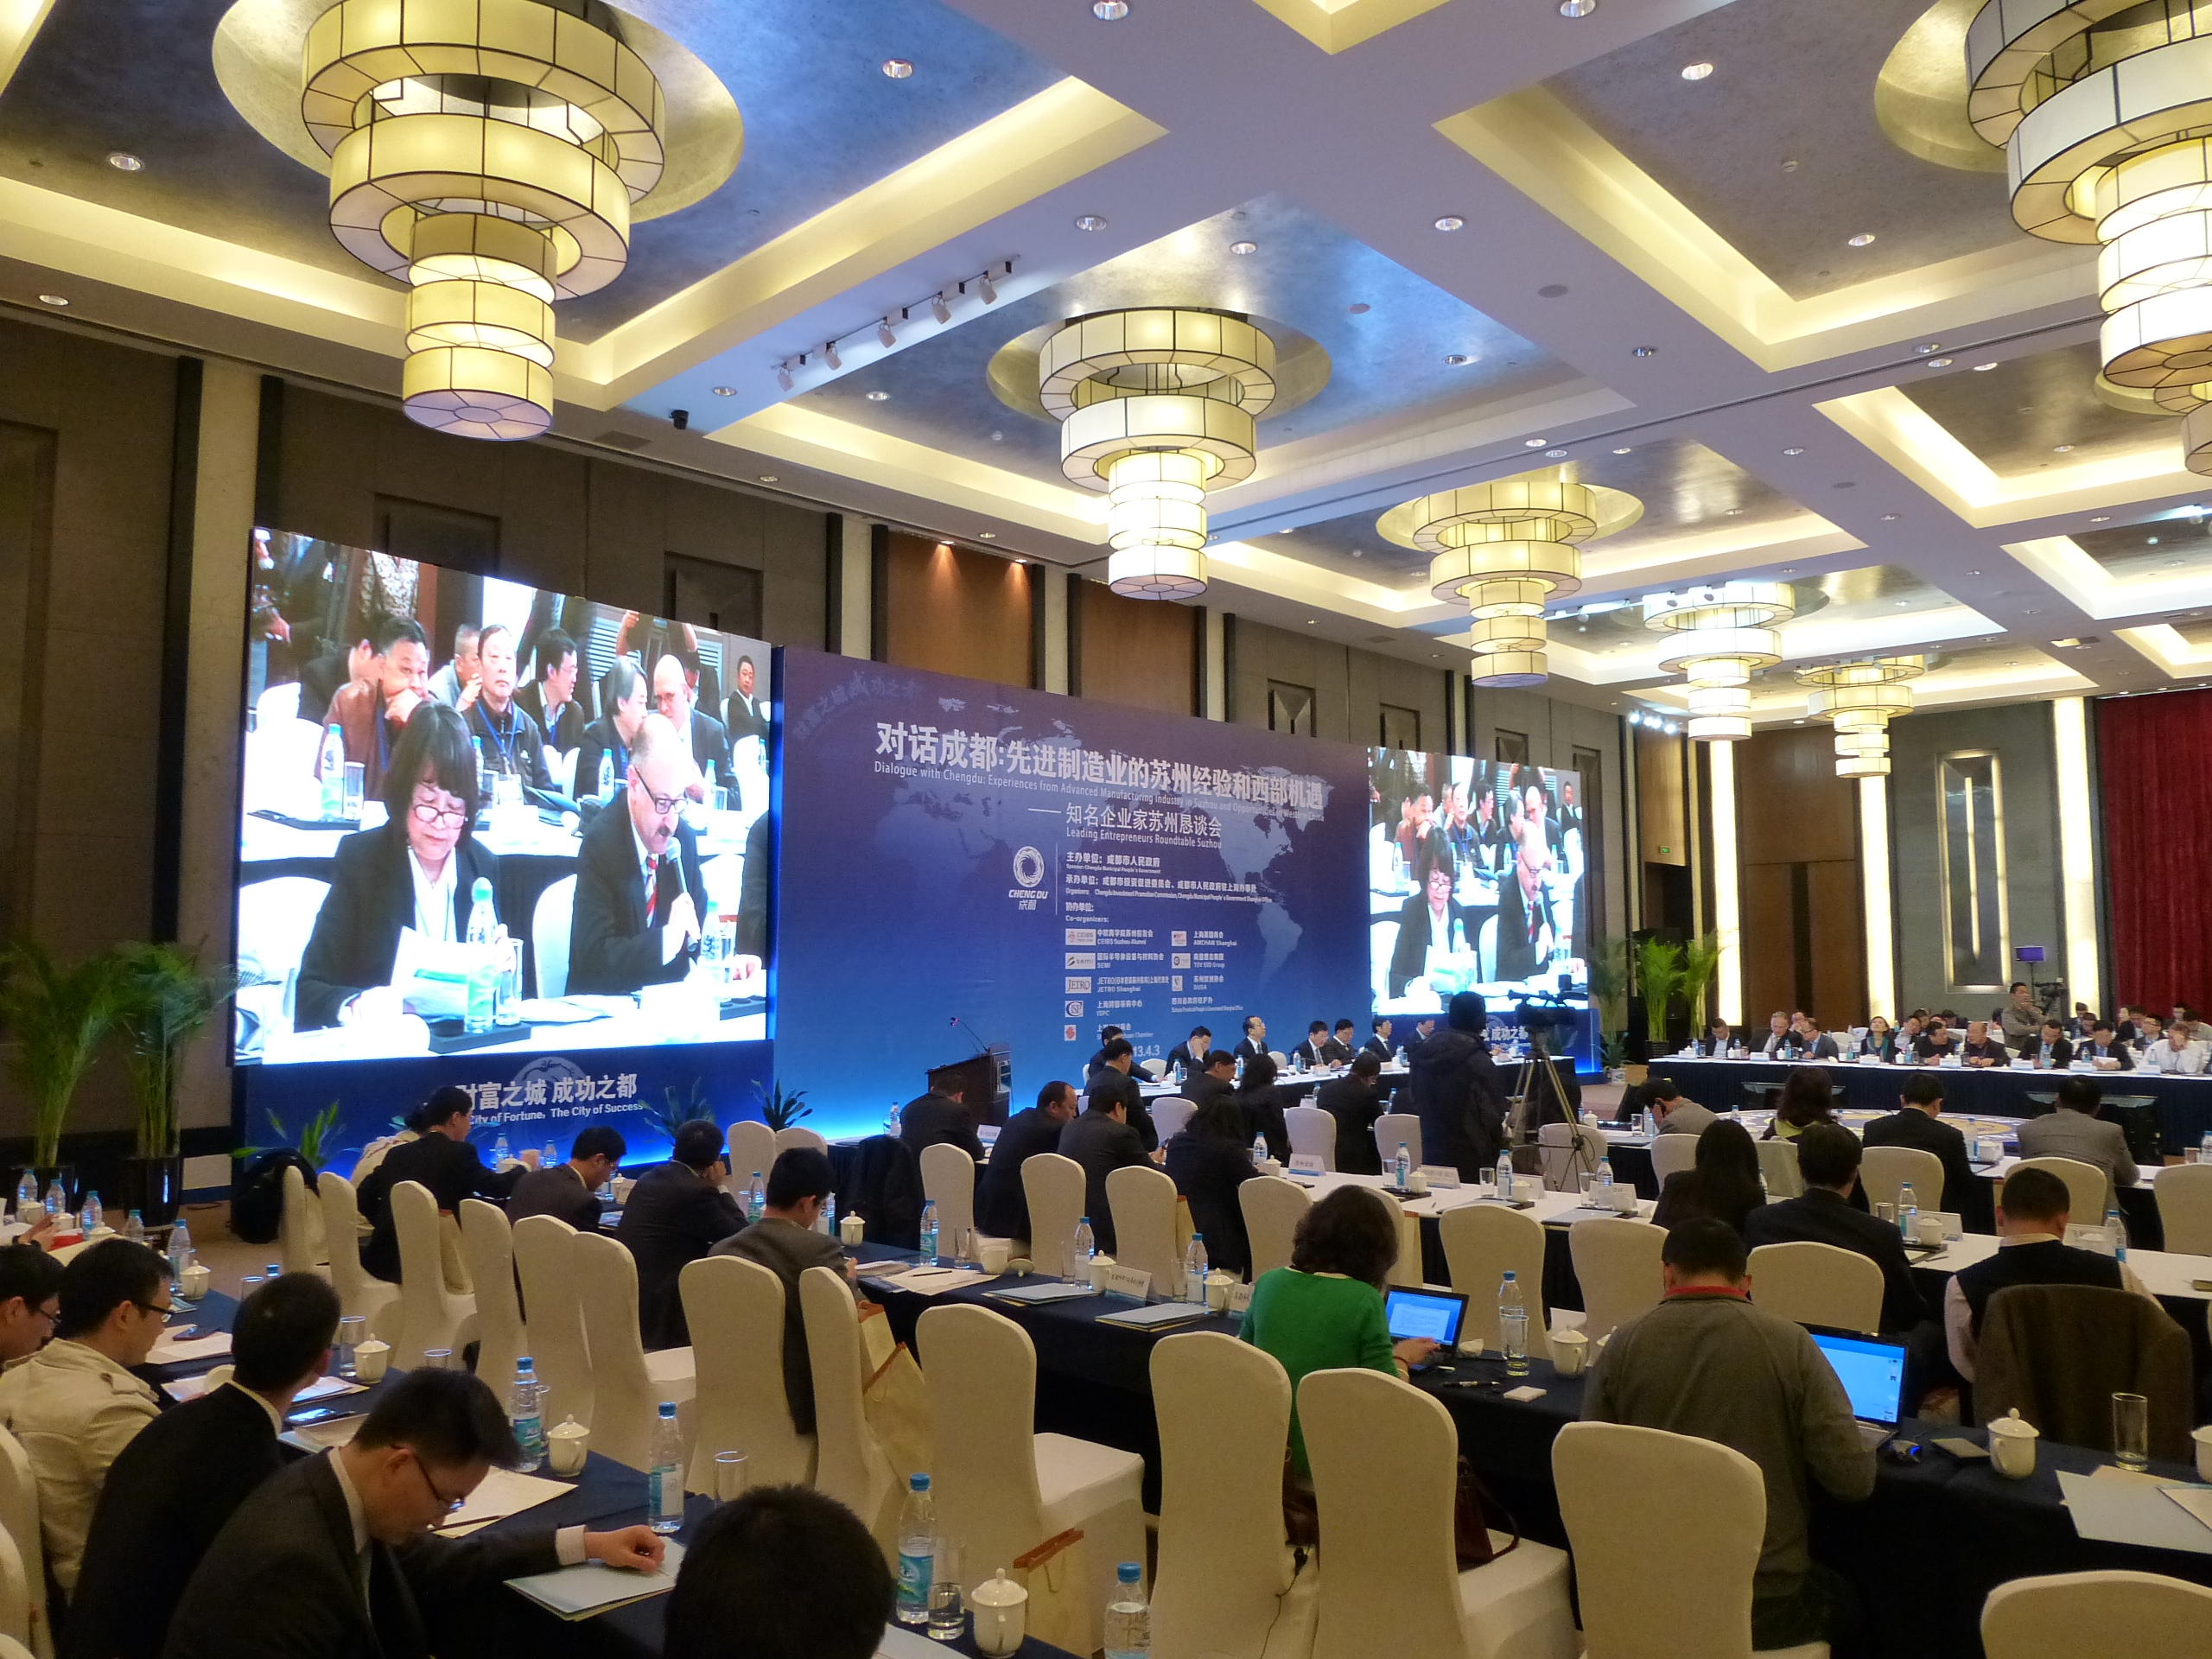
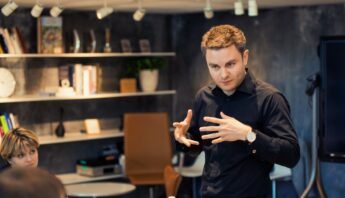
Business Innovation Congress
Established 2013
A very special event organized by StrategicInterCom GmbH and MITTELSTAND INTERNATIONAL, with the support of several big players from industry, society and government is the BUSINESS INNOVATION CONGRESS (BIC).
The main objective of BIC is to provide disruptive ideas and perspectives outside of usual business processes, as well as explore new market trends, products, services, and technological innovation.
The BIC is designed for top executives, successful entrepreneurs, senior professionals, open-minded investors in human capital and recognized academics who live and work in innovative, multi-disciplinary and cross-cultural environments.
Each year the Business Innovation Congress takes place in a different city, focusing on different themes and issues. All Congresses attracted top executives from such world-leading companies and organizations as UN, UNESCO, Siemens, Volkswagen, Vallourec, AGCO Corporation, Google, Bombardier, Alstom, SEB Bank, Royal Bank of Canada, Mercedes Benz, LEGO, Ayala Corporation, T-Systems, Deutsche Bahn Cargo, several national ministries, dozens of international universities, and leading chambers of commerce from the EU and Asia.
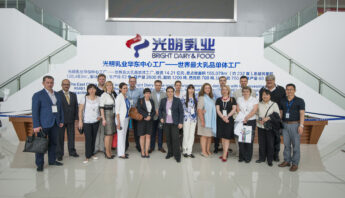
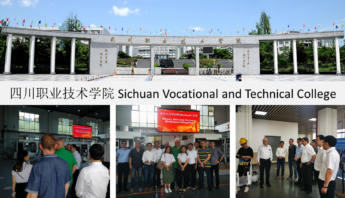
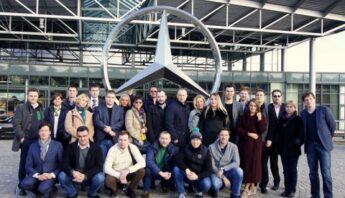
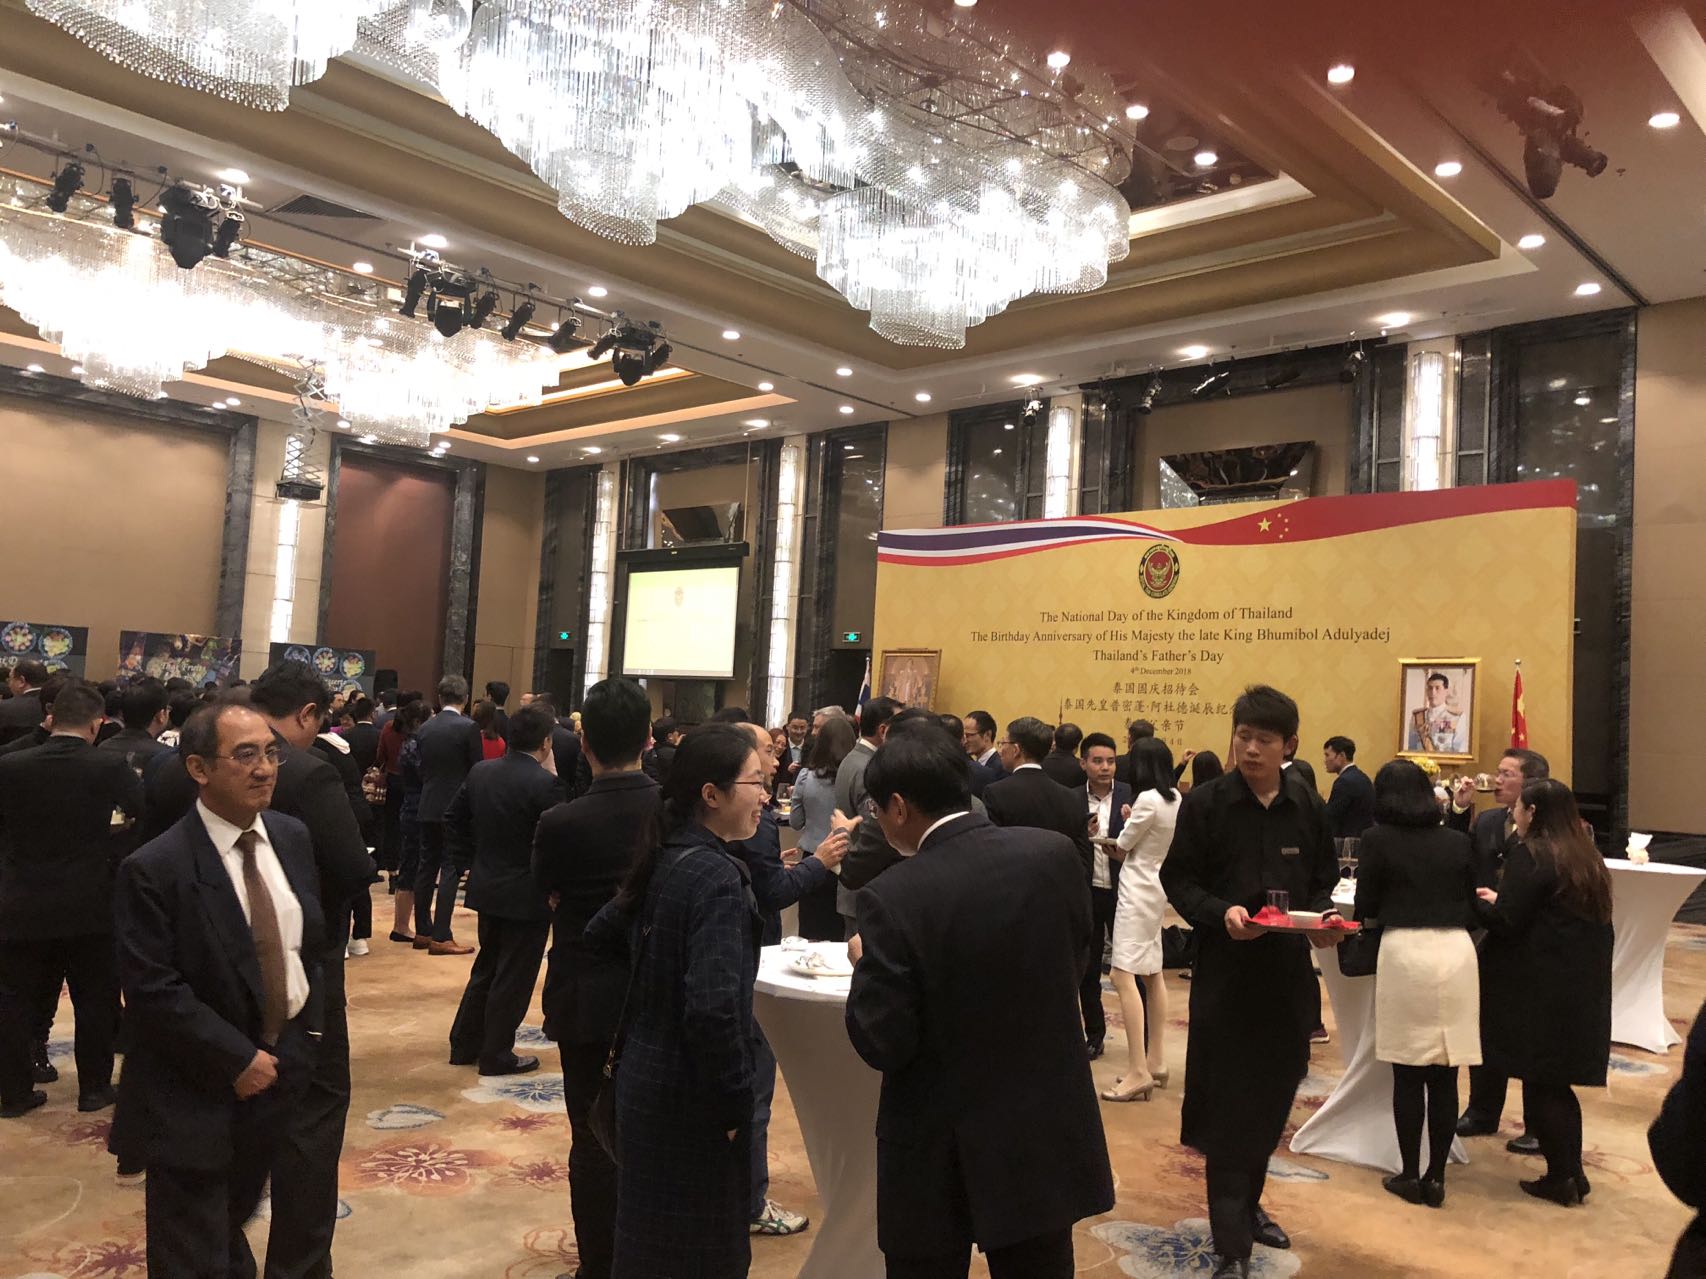
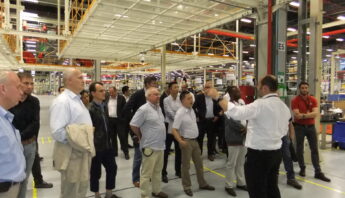
Executive Business Delegation Missions
Executive Business trips to Europe, Asia and beyond
With our exclusive business trips, we propose you rich, rigorous and global business education knowledge needed to solve the problems of tomorrow.
To provide you with an opportunity to familiarize yourself with business practices and real-world activities of international companies, we offer short-term educational sessions in parallel with visits to the world’s best companies.
Participants will have a unique opportunity to receive practical insider information from visits to highly developed companies where they encounter practical management tasks, take part in workshops by leading business consultants, exchange professional experiences with colleagues, establish new business connections, learn about the culture of Asia and Europe.
Your Benefits:
- Business networking opportunities in Europe, Asia & beyond
- Development of significant business strategy and leadership vision
- Gaining a complete set of advanced business knowledge and skills
- Working with a selected network of executive colleagues and sharing best practices
- Learning from a faculty of successful and leading experts from the world’s largest companies
Siemens, Volkswagen, Fraunhofer Institute, Google, LEGO, Vallourec, Daimler, AGCO, Commerzbank, Philips, Airbus, Hermes Logistic, Heimbach Fabrics, Bright Diary and many others
The group size is limited to 8 guests – excluding host
The target audience: company owners, senior management (CxO), board members
Our valuable Sponsors


Our Members
[excerpt]